

Key Highlights
- Business intelligence is now a multi-tens-of-billions market projected to grow significantly through 2030 and beyond.
- Despite decades of investment, only about half of business users report satisfaction with their access to data.
- The four types of analytics: descriptive, diagnostic, predictive, and prescriptive — define how BI matures inside an organization.
- The biggest gap in modern BI lives in the architectural choice between systems that report and systems that prompt action.
- AI-augmented decision intelligence is rewriting what BI looks like, and what enterprises should expect from it.
Introduction
Walk into any enterprise in 2026 and you'll find some version of the same setup: a data warehouse or lakehouse, a primary BI platform (Tableau, Power BI, Looker, Qlik, or similar), a few hundred dashboards, and a small team of analysts trying to keep up with requests from the business. The investment is real. The data exists. The dashboards exist.
What's less consistent is whether decisions are different. Industry research published in 2025 shows only a minority of organizations report meaningful enterprise-wide EBIT impact from their AI and analytics investments. According to Databricks' 2026 analysis, about half of surveyed business users report satisfaction with their data access, and over 40% are either dissatisfied or on the fence. Technology has done its job. The decisions haven't followed at the same pace.
This guide is for the CIOs, CTOs, data leaders, and product teams trying to close that gap. We'll cover what business intelligence actually is in 2026, how it got here, the technical and architectural choices that separate effective BI from expensive reporting, and what high-performing organizations are doing differently. By the end, you'll have a complete frame for evaluating your own BI investment, and for making it actually move the business.
What Is Business Intelligence, and Why Does It Matter?
Business intelligence (BI) is the set of technologies, processes, and methodologies that turn organizational data into insights that inform decisions. According to IBM's foundational definition, BI brings together data collection, data preparation, statistical analysis, data mining, and the presentation of findings through dashboards and reports. Modern BI extends this with self-service capabilities, embedded analytics, and increasingly AI-augmented natural-language interfaces.
The "why does it matter" question used to have a simple answer: BI helps organizations make better decisions faster. That answer is still right, but it's incomplete. In 2026, BI matters for three more specific reasons.
- Compliance and reporting requirements have multiplied. Regulatory regimes from SOC 2 to the EU AI Act require auditable trails for how data informs operational and customer-facing decisions. BI is increasingly the system of record for those audits.
- Operational decisions now run on shorter clocks. Pricing, inventory, marketing spend, customer churn intervention — decisions that used to happen quarterly now happen daily, often hourly. The BI layer either keeps up or it doesn't.
- The cost of bad data has gone up. AI systems trained on or supplemented by enterprise data inherit the quality and governance of that data. The organizations building BI properly today are also building the foundation for trustworthy AI tomorrow.
Business Intelligence vs Business Analytics
A common point of confusion: BI and business analytics (BA) are related but distinct. The standard framing, from IBM and aligned with Harvard Business School Online's analysis, is that BI is primarily descriptive, it tells you what happened and what's happening — while BA extends into predictive (what will happen) and prescriptive (what should we do) analysis.
In practice, the boundary blurs. Modern BI platforms now include forecasting, anomaly detection, and recommendation features that traditionally sat in the BA category. The distinction matters less for tooling decisions today and more for how organizations describe their analytics maturity.
The Evolution of Business Intelligence
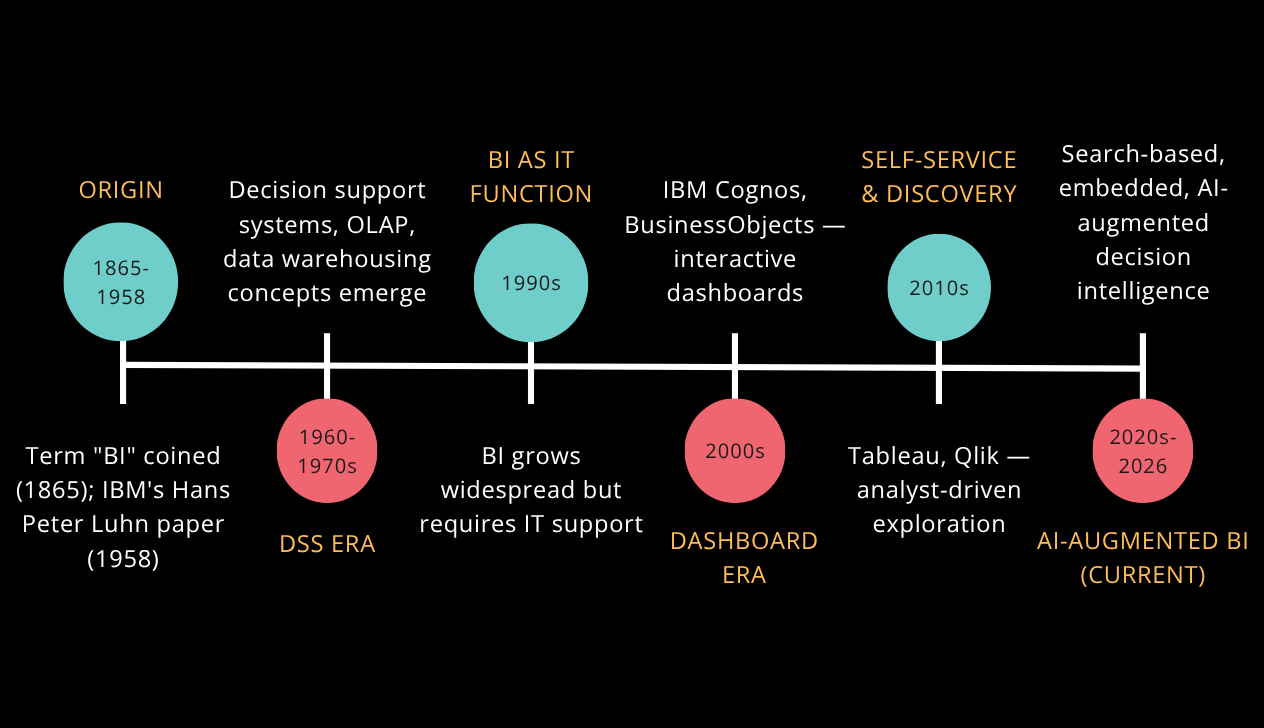
The phrase "business intelligence" was first used in 1865, when author Richard Millar Devens described a banker who collected market intelligence ahead of competitors. The modern technical lineage of BI starts almost a century later.
-
1958–1970s: Origin and Decision Support Systems
In 1958, IBM computer scientist Hans Peter Luhn published research on using technology to gather business intelligence — the foundational paper that influenced IBM's early analytics platforms. Through the 1960s and 1970s, organizations built the first decision support systems (DSS), data management systems, and online analytical processing (OLAP) tools. The vocabulary of BI — data warehousing, multidimensional analysis, executive information systems — emerged in this era.
-
1990s: BI as a Specialized IT Function
By the 1990s, BI had become widespread but technically demanding. Generating new analysis required IT support, often resulting in weeks-long backlogs. Business users couldn't run their own queries without significant training. BI was something the data team did, not something everyone in the organization participated in.
-
2000s: The Dashboard Era
Early in the 2000s, platforms like IBM Cognos Analytics and BusinessObjects introduced interactive dashboards. Users could filter data and drill into reports, a step forward from static PDF outputs. But getting any new analysis still required submitting tickets to IT, often waiting days or weeks for results.
-
2010s: Self-Service and Discovery
The 2010s brought a wave of self-service BI platforms — Tableau, Qlik, and others — that gave analysts and power users much more flexibility to explore data and create their own visualizations. Adoption widened. The bottleneck shifted: someone with technical expertise still had to build and maintain the underlying data models, dashboards, and connections before broader teams could use them.
-
2020s: Search-Based, Embedded, and AI-Augmented BI
The current era is defined by three converging shifts. Search-based interfaces let users type questions in natural language instead of navigating menus. Embedded analytics push BI capabilities directly into the applications where work happens — CRMs, ERPs, customer support tools — rather than asking users to switch into a separate BI platform. AI augmentation uses large language models, semantic layers, and compound AI agents to interpret business questions, retrieve the right data, and present results in conversational form.
The pattern across 60+ years is consistent: BI keeps improving at giving users what designers anticipated, but it's continuously challenged when real questions diverge from the pre-built model. The 2020s shift toward AI-augmented BI is the latest attempt to close that gap — and the operational implication for buyers is straightforward. The platforms being deployed today will determine whether your enterprise spends the next five years asking pre-modeled questions or asking real ones.
Key Terms in Business Intelligence
Modern BI brings together a set of technical concepts that show up across vendor documentation, analyst reports, and architectural discussions. Each one represents a design choice that shows up downstream in cost, agility, and how quickly your teams can ask new questions. Here's what each one means in practice.
- Data warehouse: A central repository for structured, query-optimized data drawn from multiple source systems. The traditional foundation of BI, designed for fast read access on large historical datasets.
- Data lake: A storage layer for raw, unstructured, and semi-structured data. Less query-optimized than a warehouse but more flexible for data science and machine learning workloads.
- Data lakehouse: An architecture that combines warehouse-style query performance with lake-style flexibility. Increasingly the default architecture for new BI deployments.
- ETL / ELT: Extract, Transform, Load (or Extract, Load, Transform). The pipeline that moves data from source systems into the warehouse or lakehouse, transforming it along the way.
- OLAP: Online Analytical Processing. The technology that supports multidimensional queries — "show me sales by region, by product, by quarter, compared to last year" — across large datasets.
- Semantic layer: A business-meaningful abstraction over the underlying data model. The semantic layer translates terms business users understand ("revenue", "customer", "active user") into the SQL or analytical queries that retrieve the right data. Critical for AI-augmented BI to produce trustworthy outputs.
- Data fabric: A unified data architecture that connects data across multiple sources, formats, and locations without requiring centralization. Helps with governance and access at scale.
- Self-service BI: BI platforms that let business users build their own reports and dashboards without IT involvement. Reduces backlogs but creates governance risks if not paired with strong data quality controls.
- Embedded analytics: BI capabilities built directly into operational applications. A sales dashboard inside the CRM. Inventory analytics inside the warehouse management system.
- Augmented analytics: Use of AI and machine learning to automate parts of the analysis workflow — data preparation, insight generation, anomaly detection, natural-language querying.
- Decision intelligence: A discipline that combines data, analytics, and behavioral science to design systems that improve actual decision quality. The Gartner term for what we'd call execution-aware analytics.
The Four Types of Business Analytics
A common framework for understanding how BI matures inside an organization breaks analytics into four progressive types: descriptive, diagnostic, predictive, and prescriptive.
Descriptive Analytics
Answer the question: What happened?
Descriptive analytics summarizes historical data using aggregation and visualization. This is where most traditional BI lives — dashboards showing revenue trends, customer behavior over time, operational KPIs against targets. Most enterprise BI activity in 2026 is still descriptive at heart.
Diagnostic Analytics
Answer the question: Why did it happen?
Diagnostic analytics goes deeper, using data mining, comparative analysis, drill-downs, and root-cause techniques to identify patterns behind business outcomes. When a marketing VP sees churn climbing and asks "why?", diagnostic analytics is what answers that follow-up — ideally without requiring a two-week analyst engagement.
Predictive Analytics
Answer the question: What is likely to happen next?
Predictive analytics applies statistical models and machine learning to forecast future outcomes. Use cases range from demand forecasting to credit risk modeling to customer churn prediction. Predictive analytics traditionally sat in the data science team; in 2026, more of it is being embedded directly into BI platforms.
Prescriptive Analytics
Answer the question: What should we do about it?
Prescriptive analytics extends prediction by recommending specific actions, often using optimization, simulation, and machine learning to suggest the best course given a set of business constraints. This is where BI starts to become genuinely actionable rather than informative.
Most enterprises mature through these types progressively. They start with descriptive (dashboards), build into diagnostic (drill-downs), invest in predictive (forecasting), and reach prescriptive (recommendation systems) only after the foundation is solid. Skipping steps generally produces brittle systems.
Reporting BI vs Decision-Driving BI: The Core Distinction
Most enterprise BI investment in 2026 still produces reporting systems. A smaller subset produces decision-driving systems. The technology can be similar. The architecture is different.
Reporting BI describes the world. It pulls data from operational systems, transforms it, and presents it to whoever opens the dashboard. The success criteria are accuracy, freshness, and adoption — measured as logins, page views, or report downloads.
Decision-driving BI changes the world. It pulls data, analyzes it, and routes the resulting insight directly into a workflow where someone is responsible for acting on it. The success criteria are decision velocity and outcome impact — measured as time from signal to action and the business effect of that action. The difference shows up in five places:
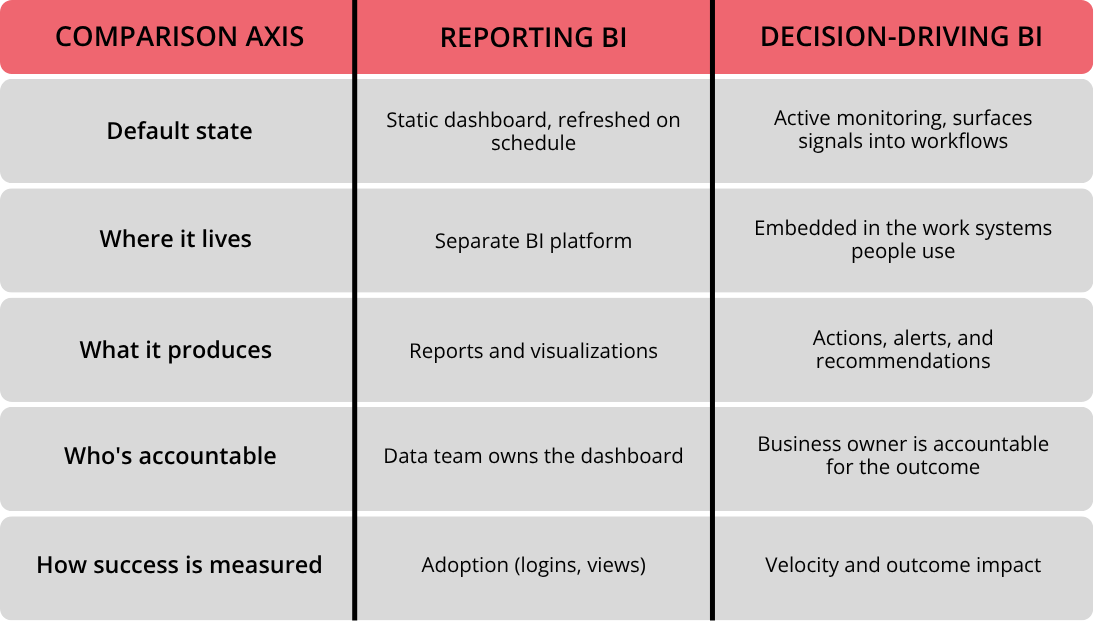
Most BI investments today optimize for the left column. The organizations capturing real ROI from BI are systematically investing in the right column. We've covered this gap in detail in our post on why enterprise analytics fails to change behavior.
The shift from reporting BI to decision-driving BI rarely requires a new BI platform. It usually requires architectural changes around the BI platform — how analytics integrates with operational systems, how alerts route to owners, how decisions get tracked and measured.
The Pros and Cons of Modern BI
Like any major technology investment, modern BI carries real advantages and real challenges. Here's a balanced view.
The Advantages
- Faster, better-informed decisions. When BI works as intended, it shortens the time between question and insight from weeks to minutes. Executives, operations leaders, and frontline managers can act on current data instead of waiting for the next monthly report.
- Consolidated view across the business. BI pulls data from CRM, ERP, marketing platforms, supply chain systems, and external sources into one analytical view. That consolidation alone often surfaces patterns no single source would reveal.
- Operational efficiency. BI helps organizations monitor performance against benchmarks, spot bottlenecks, and identify process improvements continuously.
- Foundation for AI. A clean, governed BI layer is the data foundation that enterprise AI systems depend on. Organizations with mature BI move faster on AI deployment.
The Challenges
- The dashboard sprawl problem. Without governance, enterprises end up with hundreds or thousands of dashboards, often with conflicting definitions of the same metric. Finance's "revenue" differs from sales's "revenue" differs from marketing's "revenue."
- The skills shortfall. Building and maintaining modern BI requires data engineers, analytics engineers, BI developers, and increasingly people who understand AI and machine learning. The talent market is tight.
- Up-front investment. Modern BI infrastructure — warehouses, pipelines, governance, BI tooling, training — represents a substantial spend before any insights flow.
- Adoption is hard. Even well-built BI fails if business users don't change their decision-making workflows to use it. This is the gap most enterprises underestimate, and it's where decision-driving BI architecture matters most. IBM's analysis of the BI landscape frames the central tension clearly: installing a new BI software package alone does not bring about a data-driven culture shift. Technology is necessary. It's not sufficient on its own.
What Decision-Driving BI Looks Like in Practice
Decision-driving BI shows up clearly when analytics output becomes part of operational workflows rather than something users have to seek out. Here's a pattern from our own work that illustrates the architectural shift.
Brand Optimizer for a Global FMCG Leader
In one engagement with a global FMCG company managing a portfolio of brands across personal care, food, and home categories, the teams responsible for the company's flagship brands faced exactly the gap this article is about. Scattered data with no single source of truth. Limited visibility into what was driving performance — they couldn't drill down by geography, pack size, and timeline in one view. Blind spots on attributing impact to brand strategies. An annual planning cycle that couldn't respond to in-quarter changes. Revenue, pricing, and distribution decisions were being made on stale data because the reporting workflow couldn't keep up.
The work focused on building a Brand Optimizer that turned analytics output into routine operational decisions. Four capabilities, all designed to live inside the workflow where brand teams actually worked. Brand Overview consolidated brand health, event mapping, and strategic recommendations into a single view. Brand Analytics enabled drill-down by geography, pack range, and timeline. A Scenario Simulator lets CXOs forecast revenue outcomes and test market scenarios before committing a budget. A GenAI chatbot replaced hours of manual pivots and chart-building with conversational queries about problem regions and pack sizes.
The outcomes showed what changes when analytics moves from reporting to decision-driving. Pricing recommendations on a personal-care brand expanded margin meaningfully, translating into a strong double-digit revenue lift. Improved campaign attribution justified a measured increase in marketing spend that converted directly into revenue growth on a food brand. A redirected distribution and media strategy on another personal-care brand drove a material reduction in operations costs. None of these outcomes came from a better dashboard. They came from analytics tied directly into the Annual Operational Plan and the routine decisions that flow from it.
What This Pattern Shows
The architectural ingredients show up consistently across enterprise BI deployments that actually move the business. Real-time or near-real-time operational data. Analytics embedded in the workflows where decisions are made. Forecast capability with measurable accuracy, not just descriptive views of the past. Named ownership of business outcomes — margin, revenue, cost — rather than ownership of the dashboard. None of this required net-new BI tooling. All of it required reframing analytics as part of an operational system rather than a separate reporting function.
How to Evaluate Whether Your BI Drives Decisions
A diagnostic worth running on your current BI investment. If you can't answer most of these positively, you're operating reporting BI rather than decision-driving BI.
- Can you name the specific business decisions your top 10 dashboards inform? If the answer is "they help managers stay informed," the dashboards are descriptive — not decision-driving.
- Is there a named business owner accountable for the outcome each major dashboard tracks? Without an owner, no one is responsible for translating insight into action.
- How long does it take from a new business question to a useful answer? Two weeks is typical for traditional BI. Hours or minutes is what modern AI-augmented BI delivers.
- Are insights surfaced where people work? If your sales team has to leave the CRM to check a dashboard, you're losing adoption to context-switching friction.
- Do you measure decision velocity, not just dashboard adoption? Login counts and page views measure curiosity. Time from signal to action measures impact.
- Are dashboard definitions reconciled across teams? If finance and sales calculate revenue differently in the same BI environment, you have a governance problem masquerading as an analytics problem.
- Is your BI architecture set up for AI augmentation? A strong semantic layer, governed data quality, and clear lineage are prerequisites for trustworthy AI outputs. Without them, AI bolted onto BI produces confident-sounding errors.
Best Practices for Building BI That Moves the Business
Drawing from IBM's BI best practices and what we see in enterprise engagements, six practices separate organizations that capture real ROI from BI from those that don't.
- Set clear business objectives before selecting tooling. Determine what specific decisions BI is meant to inform. Tooling decisions should follow business decisions, not lead them.
- Invest in the semantic layer. Business users shouldn't need SQL to ask routine questions. A well-designed semantic layer translates business terms into technical queries, which is the foundation for both self-service BI and AI-augmented BI.
- Govern data quality continuously. BI is only as trustworthy as its underlying data. Continuous monitoring of data quality, lineage, and access matters more than periodic audits.
- Embed analytics where work happens. Push analytics into the CRM, ERP, customer support tool, or operational system rather than asking users to context-switch into a separate BI platform.
- Assign business-side ownership of outcomes. The data team owns the BI infrastructure. Business owners own the outcomes the BI is meant to improve. Both roles are necessary, and they shouldn't sit in the same person.
- Build for measurement. Track not just dashboard adoption but the actions that follow it and the business outcomes those actions produce. Without that feedback loop, no one inside the organization can tell whether the BI investment is working.
The Finzarc View
The pattern across the research, the customer examples, and our own engagements points to one conclusion: most enterprises don't have a BI tooling problem. They have an architectural choice that shows up everywhere downstream. The choice is whether the BI investment is built to inform people or to move decisions. The two look similar from the budget request. They look different in the org chart, in the workflow integration, in how outcomes get measured, and in what gets returned to the business.
This is the work we focus on at Finzarc. We help enterprises move from BI architectures that report on the business to ones that participate in it — embedding analytics inside the workflows where decisions happen, building the feedback loops that measure decision velocity rather than dashboard adoption, and designing for the AI-augmented BI capabilities that the next generation of enterprise applications will require by default.
The real goal is decisions that consistently move the business. Better dashboards follow from getting that right, and the architecture that produces them looks different from what most enterprises build today. The gap between the two is where the next decade of BI ROI sits.
Closing
Business intelligence in 2026 is at an inflection point. The market is large and growing. AI augmentation is rewriting what BI platforms can do. The four types of analytics: descriptive, diagnostic, predictive, prescriptive are no longer separate categories but a continuous capability that mature BI architectures support together.
The organizations capturing real value treat BI as an architectural decision, not just a tooling one. They invest in the semantic layer, the governance foundation, the workflow integration, and the outcome measurement that turn analytics into decisions. The ones still treating BI as a dashboard project are the ones whose AI investments will struggle for the same reason their BI investments did.
Ready to Move Beyond Reporting BI?
If you're evaluating whether your BI architecture is built to inform or to move decisions, that's the conversation we have most often with enterprise CXOs. We'll walk the diagnostic questions in the previous section against your current setup and map the highest-impact architectural shifts.
Better dashboards follow from better decision systems.